
I hope everyone’s been well. It’s hard to believe we’re well into the final quarter of 2025 already.. but here we are !
I wanted to wait until after the September quarter to send this update so I’d be back in sync with RBA Governor Michelle Bullock who has made it clear they don’t want their decisions to rely on the monthly economic data as it fluctuates too much. Instead, team RBA has continued their trend of taking a slow and steady approach waiting for the quarterly data and announcing their -0.25% rate cuts in the middle of each quarter as shown over the last 3 quarters below.
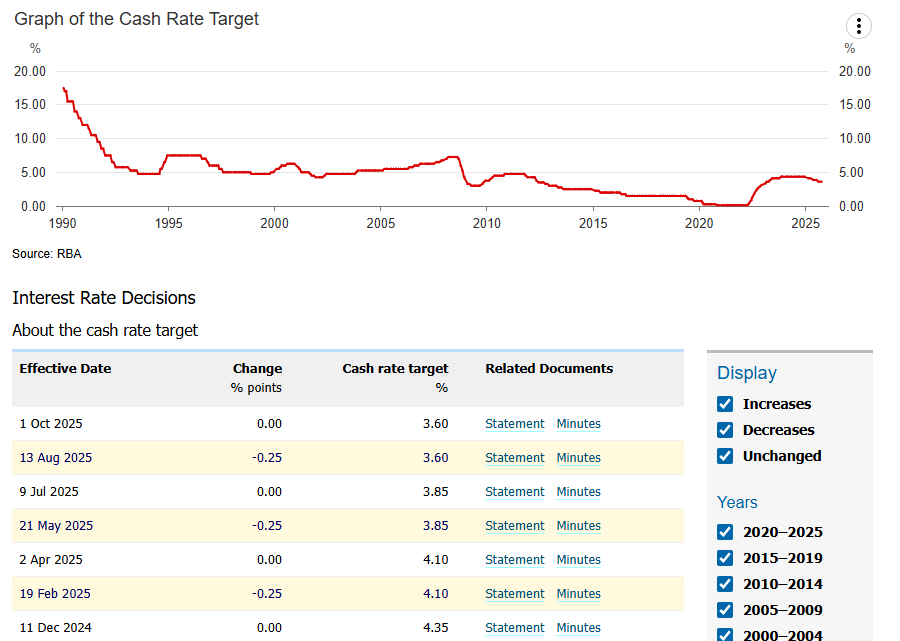
There sure has been a bit of uncertainty about this next rate cut though, mainly due to the strong June quarter GDP figure of 0.6% growth released in early September. Prior to this, the big four bank’s economists were all expecting another rate cut this side of the New Year. It was a little disappointing to see NAB revise their forecast to May 2026 while CBA and ANZ changed theirs to February.
Westpac economist Luci Ellis has been the only one to leave her November 2025 forecast and I was fortunate enough to sit in on Luci’s Economic Update presentation at Westpac’s offices in Barangaroo a few weeks ago where she admitted holding this view would be hard if we get a strong unemployment number inline or below the 4.3% forecast. However unemployment increased to 4.5% which has given the Westpac team more confidence that their forecast of a -0.25% rate cut next month on November 4th, is still the right one.
This is because the RBA’s two mandates are to keep inflation in the target range of 2-3% whilst ALSO achieving as close to ‘Full Employment’ as possible. Even if inflation is within their target range, which it currently is at 2.8%, if unemployment starts to tick up, this will put renewed pressure on the RBA to cut rates further to encourage job growth. Due to the lagging nature of all the data, there is a good chance they will do this to try and get ahead of the unemployment rate curve.
But what does this mean for the property market? I’ve attached slides from ‘Cotality’s Housing Market Webinar’ with Tim Lawless and Eliza Owens which answered all the questions:
- At a high level.. Residential real estate underpins Australia’s Wealth with 11.4 million dwellings making up $11.8 Trillion in value with $2.5 Trillion outstanding mortgage debt. That’s over 55% of our country’s wealth in residential property. (and why we’ve been hearing about Australia crossing the $1m average dwelling price milestone in the media recently)
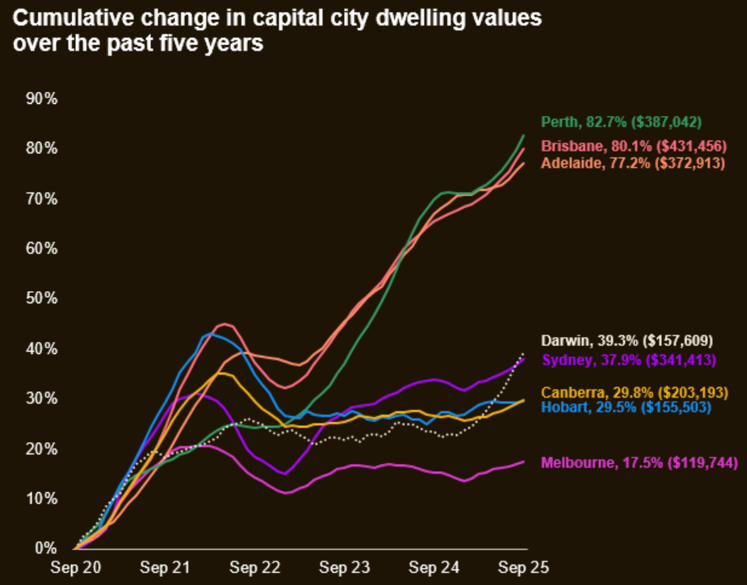
- Residential dwelling values in every Australian Capital rose last quarter and over the last 5 years. Perth, Brisbane and Adelaide all outperformed significantly with cumulative returns between 77 – 82%, while Melbourne has underperformed with a return of only 17%. This essentially didn’t even keep up with cumulative inflation of the AUD which was 19%, meaning Melbourne’s property market actually went backwards on a real cost basis over the last 5 years (and is the reason why many Buyers Agents are suggesting that Melbourne’s market is now the most attractive from an investment stand point). Sydney was somewhere in the middle at 38% growth.
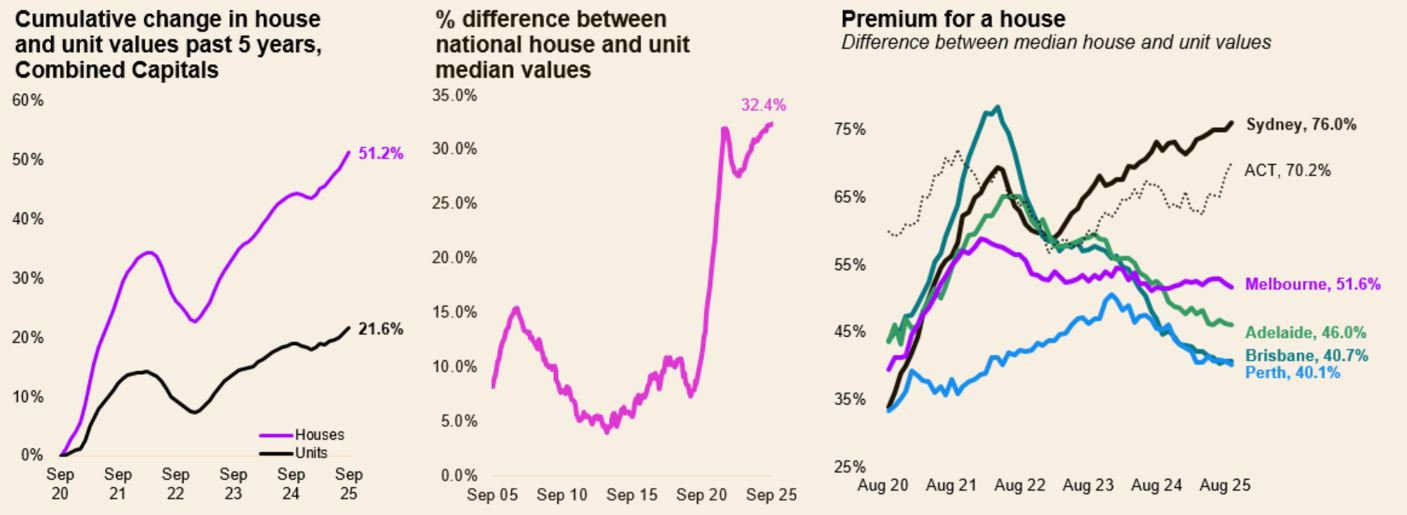
- While the national property market continues to show an ongoing preference for houses over units reaching a new record premium for houses of 32.4%, depending on which city we’re looking at, the trend could be quite different.. The premium for houses in Sydney and ACT has continued to rise, the other capitals while still all showing a preference for houses, have all seen this gap reduce, particularly Adelaide, Brisbane and Perth with premiums almost back in line with their pre-covid levels.
- We’re in more of a sellers’ market at the moment for the following reasons/Federal Gov’t polices:
- The market continues to believe that the RBA will need to lower rates further which will continue to boost peoples borrowing capacities and make property investment more attractive
- Net overseas migration to Australia is projected to reduce from 315,900 in 2025 to around 262,000 in 2026 (and then stabilise at around 230k for the next decade), however with only 176,000 new homes built in 2024 (a lot less than the projected 240,000 homes required) these levels of migration will only continue to add further housing demand
- Due to this demand, it would seem sellers on average are in no rush to list their properties for sale as they believe their property values will continue to climb in the future. Sydney and Melbourne’s listing numbers are both down 11% and 15% from last year but only 3-4% lower than their 5 year average. Meanwhile, listings in all other capital cities are a down around 20% on their 5-year averages.. which is quite significant. And these reduced listing numbers of course only fuel demand side price pressure.
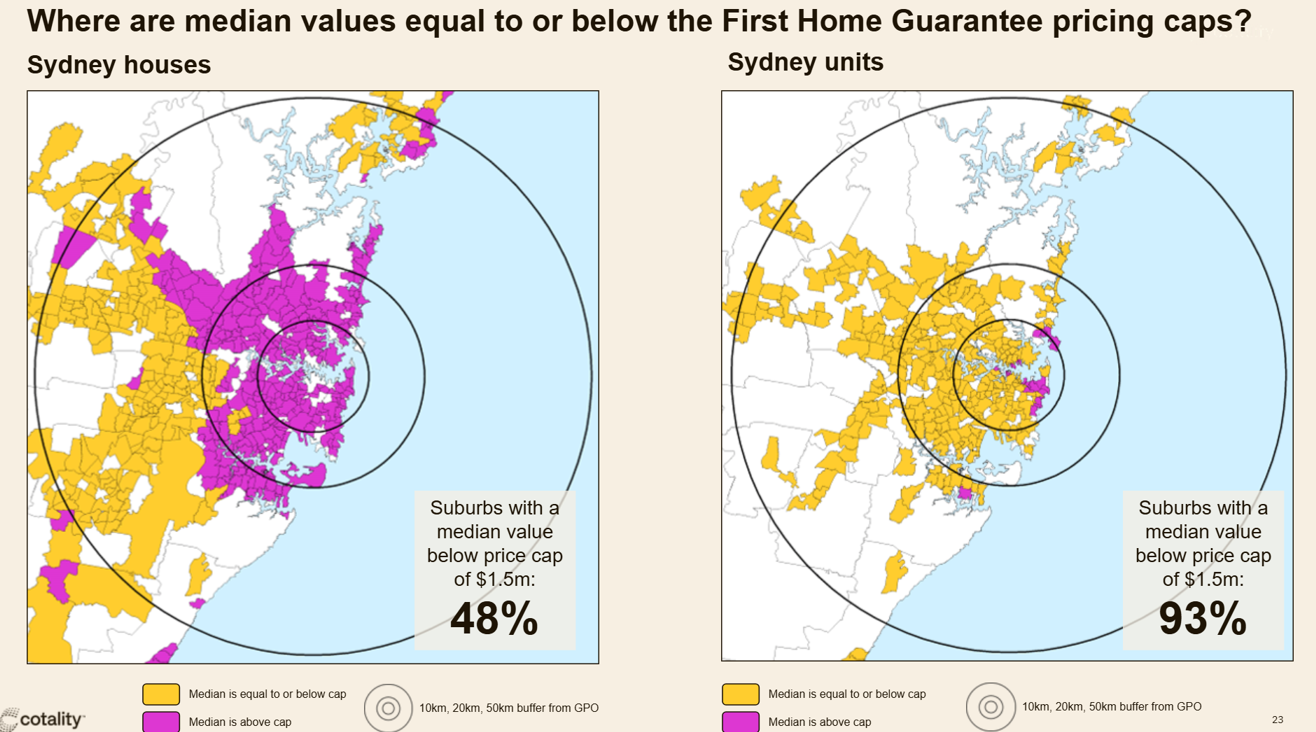
- The Federal Government has brought forward it’s expanded Home Guarantee Scheme for First Home Buyers with higher property price caps (from $900k up to $1.5m around metro Sydney) and reduced eligibility criteria restrictions such as removing the income test completely and offering an unlimited number of positions in the scheme, adding even further demand.
However, if you’re a couple (with no kids or student loans) looking to purchase your first home in Sydney at the $1.5m max price cap, you’d still need a minimum combined income of around $270k p.a and savings of $145k (5% deposit + stamp duty and costs). I’d love to know how many first home buyers around Sydney fall into this category, but I can’t imagine the property price needle will be moved much around that $1.5m purchase price.
And the good news is, at $1.5m you should still be able to find a unit anywhere across Sydney as the below diagram indicates. If you’d like a house with some land though, it would seem you’ll still have a decent commute if you’re working in the CBD. (See attached slides for other States)
In conclusion, apart from letting everyone know I’m here whenever they need, the main reason I send this email and track the economic data and RBA decisions, is so we can all stay relatively informed to one day make a judgement call on whether it might make sense to start looking at fixed rates again. That time is definitely getting closer, however personally I don’t feel we’re quite there yet.
Saying that, we all know that picking the bottom of the interest rate cycle is very hard, particularly with all the geopolitical events and news affecting our globalised credit system. Lenders are currently offering their lowest fixed rates for a 2 year fix, which start from a P&I rate of 4.89%. 1 and 3 year fixed rate offerings are very similar starting around 5.09% and 4.99% respectively, while both 4 and 5 year fixed rates are starting from 5.29%.
Everyone’s in different positions, with some of you looking to prioritise cash flow and repayment certainty over the possibility of lower rates. If anyone would like to fix their rate or even just talk to me about their options, please reach out.
Until next time,
Daniel
(And if you’d like to unsubscribe from my quarterly (ish) emails just let me know. No hard feelings.)
No responses yet